Lions, Tigers and Carbon, Oh My! Denver Zoo’s 2022 Greenhouse Gas Assessment
In the summer of 2023, Denver Zoo partnered with Colorado State University’s (CSU) Impact MBA Corporate Sustainability Fellowship program to conduct a comprehensive zoo-wide Greenhouse Gas Assessment.
CSU Impact MBA graduate student Miki Salamon was brought in to lead the charge and perform a greenhouse gas (GHG) analysis of Denver Zoo’s Scope 1, 2 and 3 emissions. The team at Denver Zoo realized they had an opportunity to address their climate commitments beyond the horizon of 2025 and update their Environmental Management System (EMS).
The goal of the project was to shift the high-level thinking about Denver Zoo’s global impact, utilizing the GHG data to form new reduction goals and target individual bucket areas. The emissions data gathered by Salamon would help narrate that story to the organization.
Advancing Sustainability
No stranger to the climate space, Denver Zoo has been implementing climate positive design into their campus operations for many years, focusing mainly on water recycling, waste management, and landfill diversion. Leadership realized an opportunity to address the complex focus area of energy, however, which can be the most difficult and expensive climate area to tackle.
A campus-wide energy reduction goal was adopted at the end of 2019 – right at the beginning of the COVID-19 pandemic. Denver Zoo sits on a large urban campus with very old infrastructure. The Zoo is currently hovering around a 6% energy reduction from 2019 levels, which is much smaller than the targeted 25% – 50% reduction target of the Paris Agreement.
Blair Neelands, Sustainability Manager at Denver Zoo, realized they needed to step back from big “fun” projects – solar, for instance – and bring focus to upgrading outdated equipment like boiler systems, life support systems, and heat pumps. “It’s not the fun stuff, but it is the practical,” says Neelands.
Hence, a comprehensive Greenhouse Gas Assessment was initiated by Impact MBA candidate Salamon. The Zoo’s 2022 energy data was utilized to establish new baselines and create a new framework for climate action and energy system upgrades.
Scope 1
For Scope 1 emissions – e.g., emissions created directly on campus – Miki Salamon focused on the three traditional analyses while also including a category unique to zoos and aquaria:
- Stationary Combustion – emissions from natural gas combustion
- Mobile Combustion – emissions from direct fleet transportation
- Fugitive Emissions – emissions from refrigerants and A/C
- Animal Husbandry – emissions resulting from animal care
While not technically mandated by the greenhouse gas protocol, Denver Zoo decided to include animal husbandry in this Scope 1 analysis because the Zoo owns these assets and is responsible for the direct emissions. DZ staff and leadership were invested in seeing what emissions were resulting from animal care, so Salamon decided to tackle it.
Scope 2
For Scope 2 emissions – e.g., emissions created from purchased electricity – Salamon looked at their purchased electricity from Xcel Energy, Denver Zoo’s primary energy provider.
With Scope 2 analysis, there are usually two calculation methods. One option is to calculate using the general location-based method, which is based on the eGrid regions that are designated by the EPA. The other option is a market-based method that utilizes specific emission factors from your energy provider. For Denver Zoo, which is located in the Rocky Mountain region, Xcel Energy provides specific emission factors because they’re working on renewable targets.
The Zoo ended up using calculations from both methods to have the comparison, but the number actually reported will be the market-based factor.
Scope 3
For Scope 3 emissions – e.g., emissions that result from assets not owned or controlled by the institution, but that indirectly affect the organization’s value chain – Denver Zoo decided to partially tackle several categories including:
- Business travel
- Staff and volunteer commuting
- Guest travel
- Animal transport
- Waste produced through operations
- Animal nutrition procurement
Salamon looked at many forms of travel to and from campus, namely employee commuting (which includes staff and volunteers), business travel, and guest travel. Guest travel is a category not mandated for reporting yet results as a huge part of business operations. “Denver Zoo has a great comprehensive guest demographic tracking survey,” says Salamon. “They do a biannual survey and there was a ton of data there; the thinking was to see where people are coming from and the emissions that result from visitation.”
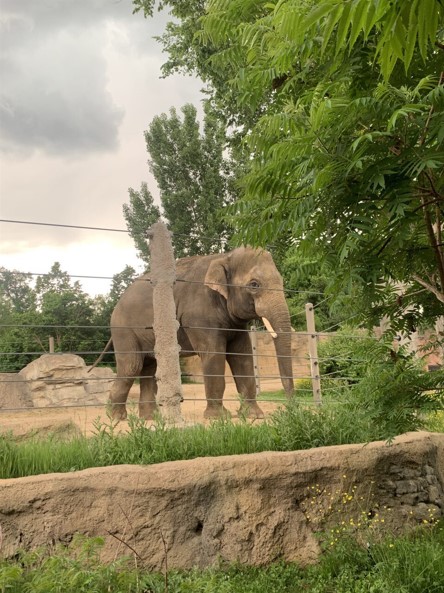
Denver Zoo also wanted to focus on animal moves and transportation since a large amount of animal transport happens throughout the year (in 2013, for instance, an elephant was brought into the Zoo from Belgium). Again, while this was a category not specifically mandated or required, Salamon felt it was important to address the zoo’s Category 4: Upstream Transportation and Distribution standard.
Finally, the remaining categories tackled were waste generated in operations and procurement, which is huge at the zoo (and at most organizations) and tends to be massive and sprawling. Salamon was unable to perform the entire analysis for this reason, deciding to focus more narrowly on the procurement associated with Denver Zoo’s animal feed and nutrition team.
Data Collection
Salamon scheduled meetings with different operations staff at Denver Zoo throughout the summer, requesting the various streams of data necessary to conduct the GHG audit. Salamon says she got lucky in that most of the data had already been compiled and was able to be retrieved with relative ease.
A large energy spreadsheet had already been aggregated with totals, kilowatt hours, and megawatt hours per building. For fleet travel, Salamon poured over the mileage books to determine the Zoo’s fleet transportation emissions. For business travel, she asked the executive assistant to pull data from the executive travel records. Salamon also met with the Zoo’s field conservation director, who is quite passionate about sustainability – she was able to pull numbers about flights, number of staff traveling, where they went, how long they were there, etc. For employee travel, a survey for staff commuting had already been created and Salamon created another survey to collect volunteer commuting data.
“The animal info was particularly interesting to track down,” says Salamon. “Denver Zoo uses what is called ‘the registrar’, which can pull any type of data that I’m interested in. I was also given a login password for the Zoo’s tracking software: access to all of our animal files, entries in their weights, notes and the daily influx of data – similar to a hospital that keeps records of health profiles.”
Waste tracking was already in place from one of the Zoo’s coordinators and animal nutrition information was aggregated through collaboration with the Zoo’s Nutrition Director.
GHG Calculators
Salamon ended up performing the calculations herself based on reading the Greenhouse Gas Protocol standards and then utilizing the EPA Simplified Greenhouse Gas Calculator to verify those results. SIMAP, a carbon and nitrogen accounting platform, is another comprehensive GHG analysis tool, yet Salamon found the open-source EPA simplified calculator to be the most helpful in terms of the zoo-related categories.
Results
At the end of the summer, Salamon delivered her 2022 emissions analysis and presentation to Denver Zoo’s staff and leadership board.
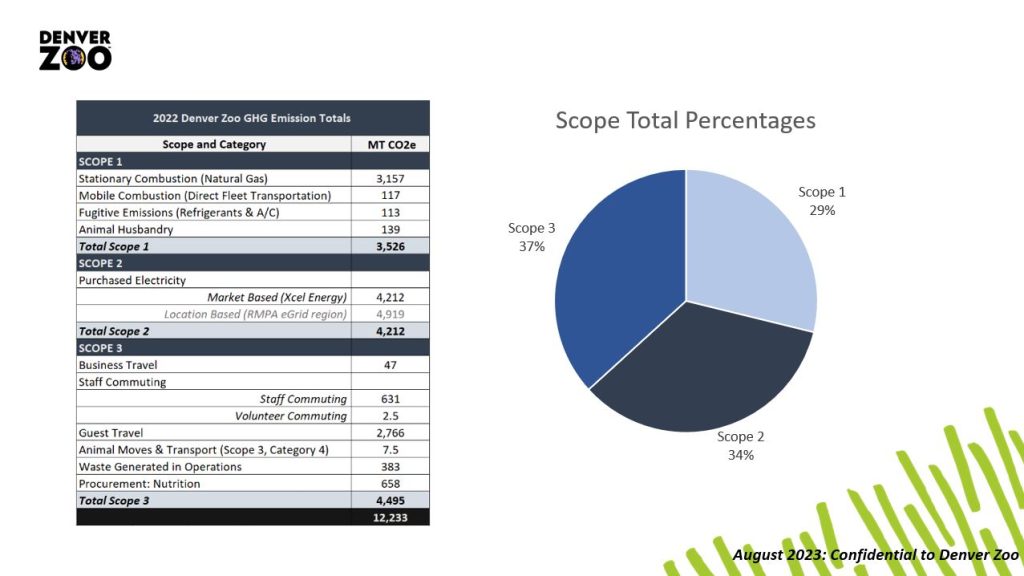
For the final results, Denver Zoo’s total emissions ended up being just over 12,000 metric tons of CO2. The Zoo’s Scope 1 (direct combustion) total was 3,526 metric tons of CO2. The Scope 2 total (purchased electricity) was 4,212 metric tons of CO2. Lastly, the Scope 3 total was 4,495 metric tons of CO2. “Looking at the pie chart, all the thirds are relatively equal which is uncommon when doing a GHG audit which includes Scope 3,” admits Salamon. “Based on the categories mapped, if the entirety of procurement had been tackled along with some other aspects of our scope three value chain, the final emissions figure would’ve been higher.”
Miki Salamon ended up connecting with a consulting firm that works closely with zoos and aquaria. The firm reported that there are big-name organizations that are doing inventories but not publishing those numbers. Salamon was able to find one comparable audit from Philadelphia Zoo that was a few years old. Their emissions were in the range of 8,000 metric tons of CO2 and they only performed analysis on Scope 1 and Scope 2.
As far as zoos and aquaria are concerned – and for Denver Zoo’s size and scope – 12,000 metric tons of CO2 is basically the middle of the road. The zoo is right in alignment with many other similar-sized organizations.
Takeaways and Recommendations
Data informs decision-making.
Denver Zoo’s recommendation for institutions looking to get started in calculating their emissions is to read through the Greenhouse Gas Protocol standards, as well as the recently released WAZA Carbon Guide. Think about the data you have available and do the best you can. Approach the data as pure information; it’s not good or bad, it just is.
Performing an emissions inventory gives you measurable and science-based targets that can be utilized to identify your institution’s new goals.
Now that Denver Zoo has data on what their actual emissions are and where energy usage is the highest, it further confirms the need to focus on reduction and decarbonization: addressing energy efficiencies, electrifying the grid, and supporting community initiatives in the area.
It also validates the process. If you’re thinking about ways to encourage your management and organizational leadership to implement climate solutions, conducting an emissions inventory and presenting the results is a great opportunity to highlight leverage points and areas of intervention.
“And that’s probably a wise argument to present to a board of directors,” says Salamon. “You can’t really argue with the empirical data. If we want to see emissions go down, we need to focus on it.”
Impact MBA
If interested in tackling climate action work while collaborating with the next generation of thought-leaders and policymakers, consider hosting an Impact MBA student at your institution.
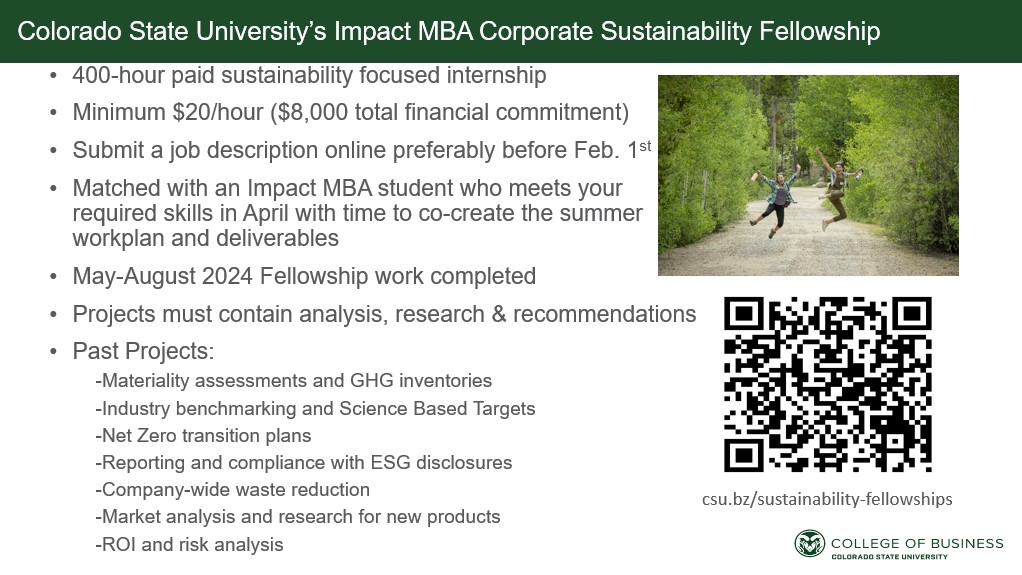
Please get in touch Kathryn Ernst, Director of Impact MBA, for more information:
Kathryn Ernst
Director, Impact MBA
970-692-1421
Kat.Ernst@colostate.edu
Resources
- Denver Zoo Sustainability Policy
- Denver Zoo’s Eight Priority Sustainability Objectives
- WAZA Carbon Reduction Garden for Zoos and Aquaria (World Association of Zoos and Aquariums)
- Simplified GHG Emissions Calculator (Environmental Protection Agency)
- GHG Standards (Greenhouse Gas Protocol)
Recent Comments